Editor
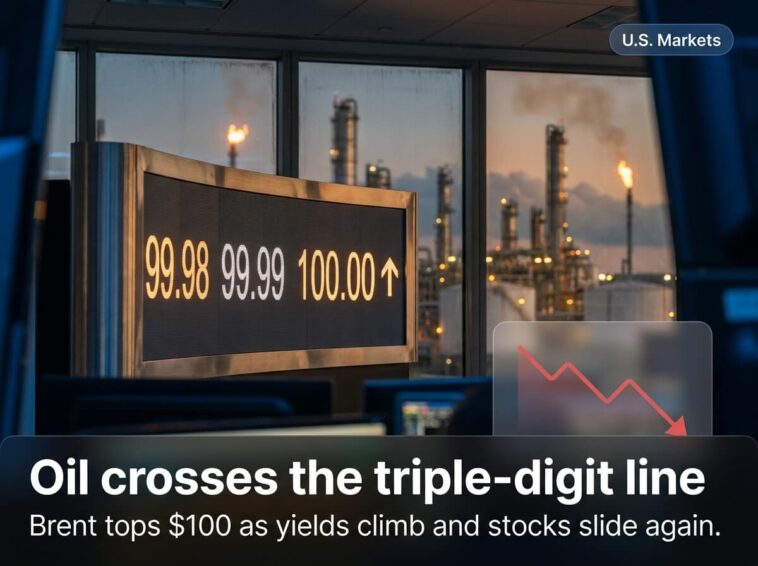
Brent Crude Tops $100. The Timing Couldn’t Be Worse for the Fed.
Brent crude tops $100 a barrel Wednesday morning, its highest level since July. The 10-year Treasury yield jumped to 4.81%. Rate-sensitive stocks and sectors took the biggest hit of the morning, right as this week’s CPI and PPI inflation data loom on the calendar.
The Dow fell 293.77 points by mid-morning, down 0.56%, to 52,491. The S&P 500 dropped 0.31%. The Russell 2000 fell hardest, off 0.72%. Two straight sessions of losses now, after Tuesday’s 628-point Dow tumble, itself a follow-up to Friday’s 272-point decline. This isn’t a one-day scare anymore. It’s a genuine losing streak, and oil’s the thread running through all of it.
Why Brent Crude Topping $100 Changes the Inflation Calculation
Here’s the number that matters more than the headline itself. Triple digits on Brent isn’t just psychologically significant. It’s the level where energy costs start bleeding meaningfully into every downstream price measure the Fed watches closely.
“A hundred dollars a barrel isn’t a magic threshold in some mechanical sense, but it’s psychologically real for markets, and it’s arriving at the worst possible moment,” said Marcus Thorne, Head of Macro Strategy at a New York boutique advisory firm. “We’ve got CPI and PPI data landing this week, right as oil’s crossing a level that makes every inflation forecast from the last month look too optimistic. If those prints show energy costs already showing up in headline numbers, the Fed’s September decision gets a lot less ambiguous, and not in the direction markets were hoping for.”
Daniela Hathorn, senior market analyst at Capital.com, framed the stakes plainly Wednesday: “U.S. rate expectations have shifted accordingly, while upcoming inflation data will be particularly important in determining whether $100 oil is beginning to feed more materially into the Fed outlook.” That’s the entire market’s attention, condensed into one sentence. Tuesday’s selloff already reflected genuine concern that the energy shock could stall disinflation and force the Fed to stay more restrictive than anyone wanted heading into fall.
Layered onto an already tense morning: the White House announced it would ban imports of Canadian motorbikes and a slew of other products starting later this week, adding fresh trade friction on top of the oil and rate story. Amazon’s stock fell about 1% after launching its first-ever sterling bond sale, a four-part offering seeking at least £3 billion, a reminder that even mega-cap balance sheet moves are getting parsed through this week’s rate-sensitive lens.
Not everything was red, though. Dell hit an all-time high, up 4%, after an Evercore analyst laid out a path to $1,000 a share, citing AI adoption and de-commoditization in IT infrastructure. Meta’s chief AI officer posted that early usage of its new Muse product “has blown way past our projections.” Semiconductors and broader AI leadership remain the cleanest bright spot in an otherwise grim tape, with chip-tracking ETFs still showing gains even as the broader market retreats.
The Skeptic Who Says This Oil Spike Gets Overplayed
Not every strategist thinks $100 oil rewrites the entire macro outlook.
“We keep treating each new dollar milestone in oil like it’s a phase change in the inflation story. Mostly, it isn’t,” countered Elena Voss, senior equity strategist at a Chicago research shop. “Energy pass-through to core inflation takes months to show up fully, not days. This week’s CPI print reflects August pricing, largely before this latest leg higher in crude even happened. The real test comes with September and October’s data, not this week’s. I wouldn’t assume Wednesday’s print settles anything about whether triple-digit oil actually changes the Fed’s calculus.”
Voss raises a fair technical point. Inflation data released this week captures a prior month’s pricing, meaning the freshest oil spike hasn’t fully worked its way into the numbers investors are about to see. The real test, by her logic, sits a month or two further out.
What This Means for Your Portfolio
Here’s the practical read for retail investors navigating a genuine three-session losing streak with real macro substance behind it.
When oil crosses a round-number threshold like $100 during an active, unresolved geopolitical conflict, the market’s reaction tends to reflect forward-looking fear more than backward-looking data. That’s exactly the dynamic driving Wednesday’s selloff, even before this week’s CPI print technically confirms anything about oil’s actual inflation impact.
The practical move: don’t wait for confirmation before checking your exposure to rate-sensitive sectors specifically. The Russell 2000’s outsized 0.72% morning decline, worse than either the Dow or S&P, is the clearest signal of where this pressure concentrates. Small caps carry more floating-rate debt and less pricing power than mega-caps, making them the first casualty whenever yields jump this sharply. If you’re holding meaningful small-cap exposure, this week’s data deserves real attention, not a passing glance.
Watch two things closely through Friday. First, whether this week’s CPI and PPI actually show early signs of energy pass-through, or whether Voss’s timing argument holds and the real test waits for next month’s data. Second, whether Brent holds above $100 through the week or fades the way several earlier Iran-driven spikes have. Either outcome tells you something concrete about whether this losing streak has more room to run, or whether it’s another entry in a summer that’s had no shortage of them.